- Question
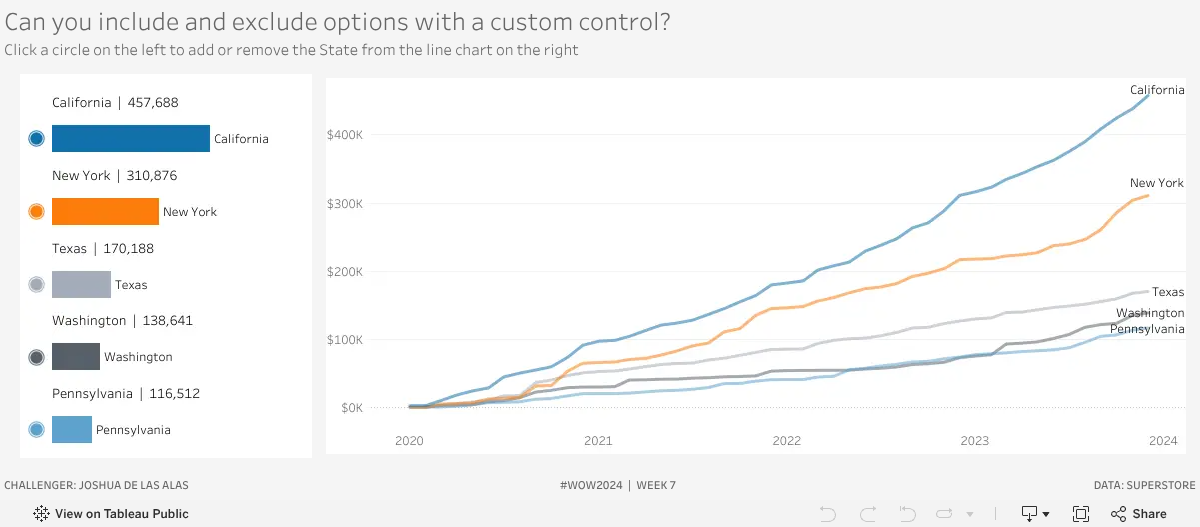
- Where do sales come from, by month, state, retailer and sales method?
- Data
- Adidas US sales, 2020 and 2021
- Built with
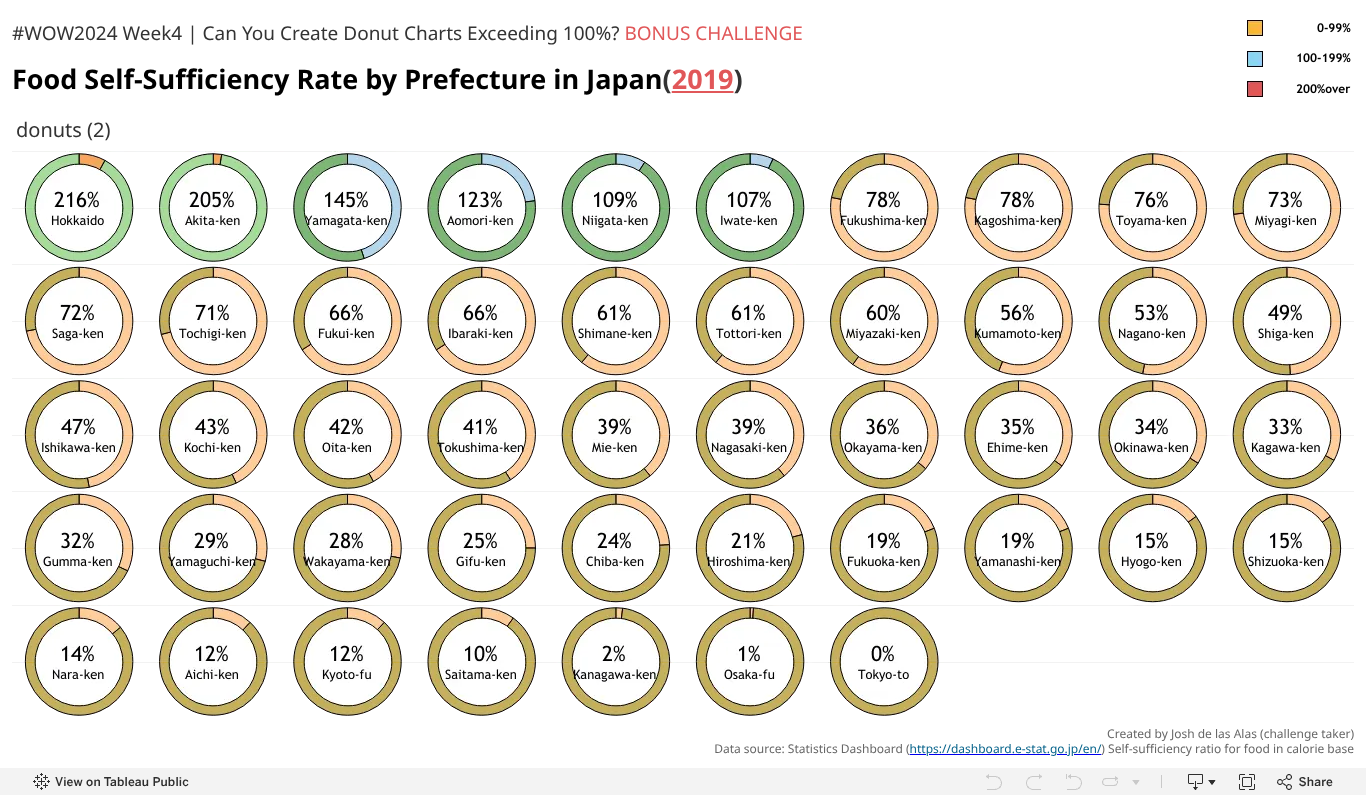
- Line, map, donut and bar views, with product, region and year filters
- What it shows
- In 2021, $718M in sales, with Foot Locker the top retailer at $177M.
Updated November 2026
Get the numbers right. Then put AI to work on them.
I’m Josh de las Alas, a business intelligence analyst. I make sure the numbers leadership decides with are correct, then automate the reporting so it shows up on its own.
7+ yrsin business intelligence and automation
50+Tableau dashboards built and maintained
90%less manual dashboard refresh work
30+ hrsof manual reporting saved each week
Every company has a spreadsheet like this.
Duplicates, blanks and three date formats.
First, the numbers get fixed.
Duplicates out, blanks filled, one date format, sorted by revenue.
Now leadership gets an answer.
Which region brings in the most revenue? South
Portfolio
Category
Tool
- Question
- Which states, age groups and quarters bring in the most profit?
- Data
- Retail orders, 2012 to 2015
- Built with
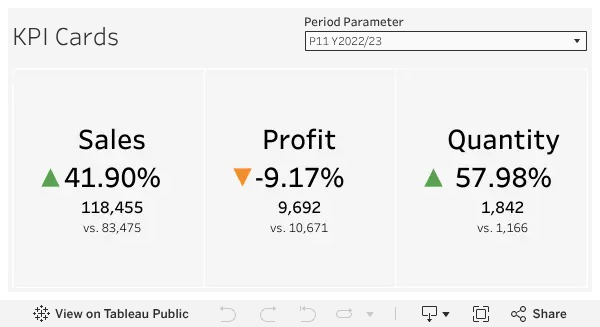
- KPI header, state map, an age bin parameter and a quarterly heat table by region
- What it shows
- Average profit of $181.18 at a 4.97% average discount, and the oldest age group is the only one at a loss.
- Question
- How fast do orders ship, and which products and customers drive volume?
- Data
- 1,723 orders with shipping, product and segment fields
- Built with
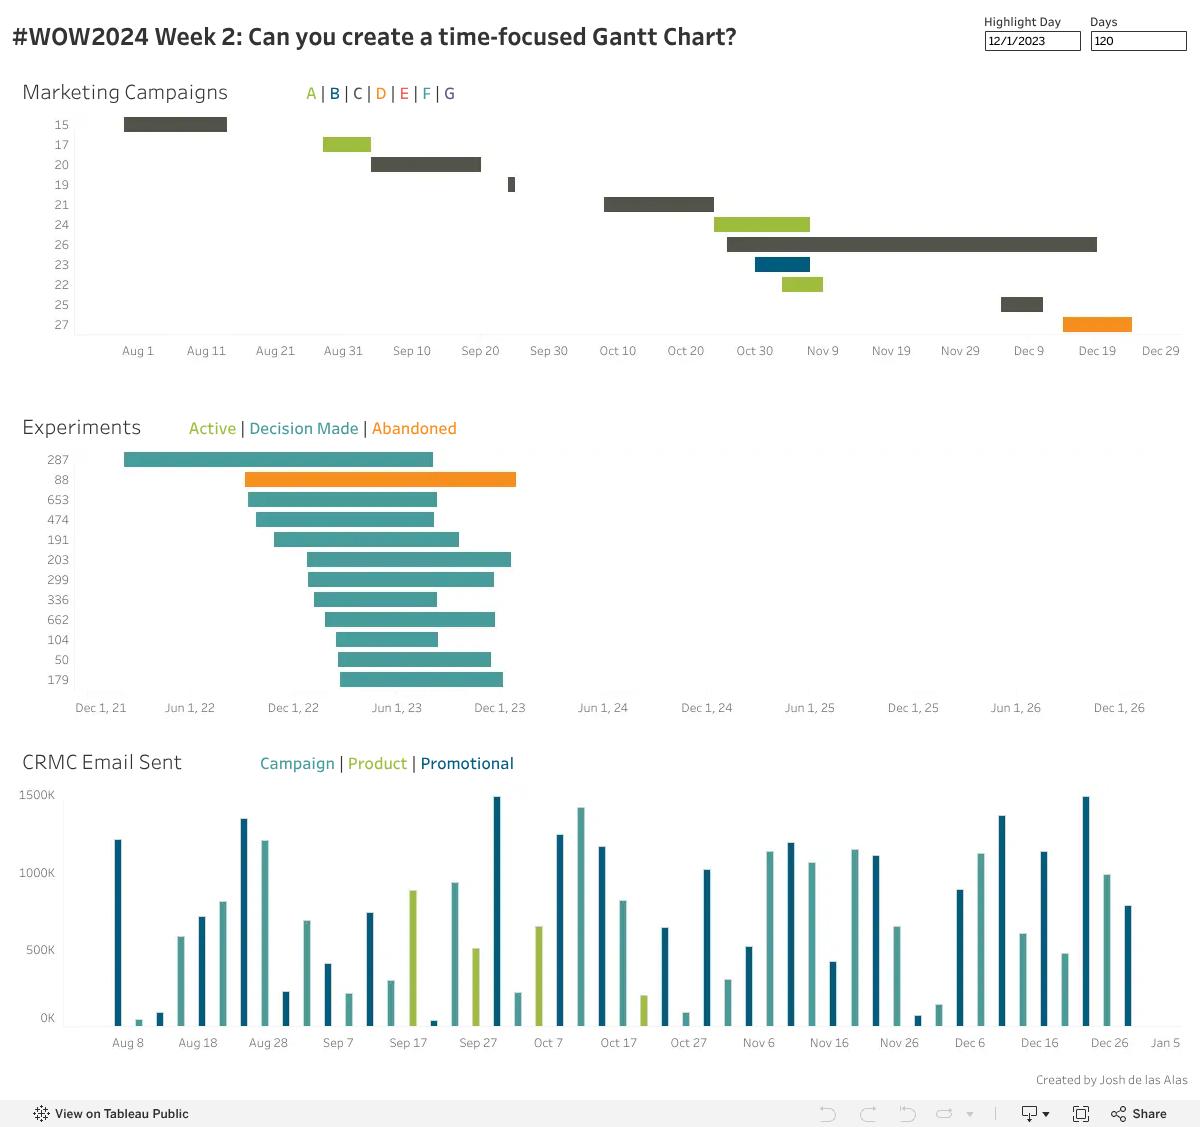
- KPI tiles, stacked bars by region, quarterly segment columns and a year filter
- What it shows
- Orders ship in 4 days on average at $9.61 each, and binders and paper lead order volume.
- Question
- Where is attrition happening, and who is leaving?
- Data
- 1,470 employee records
- Built with
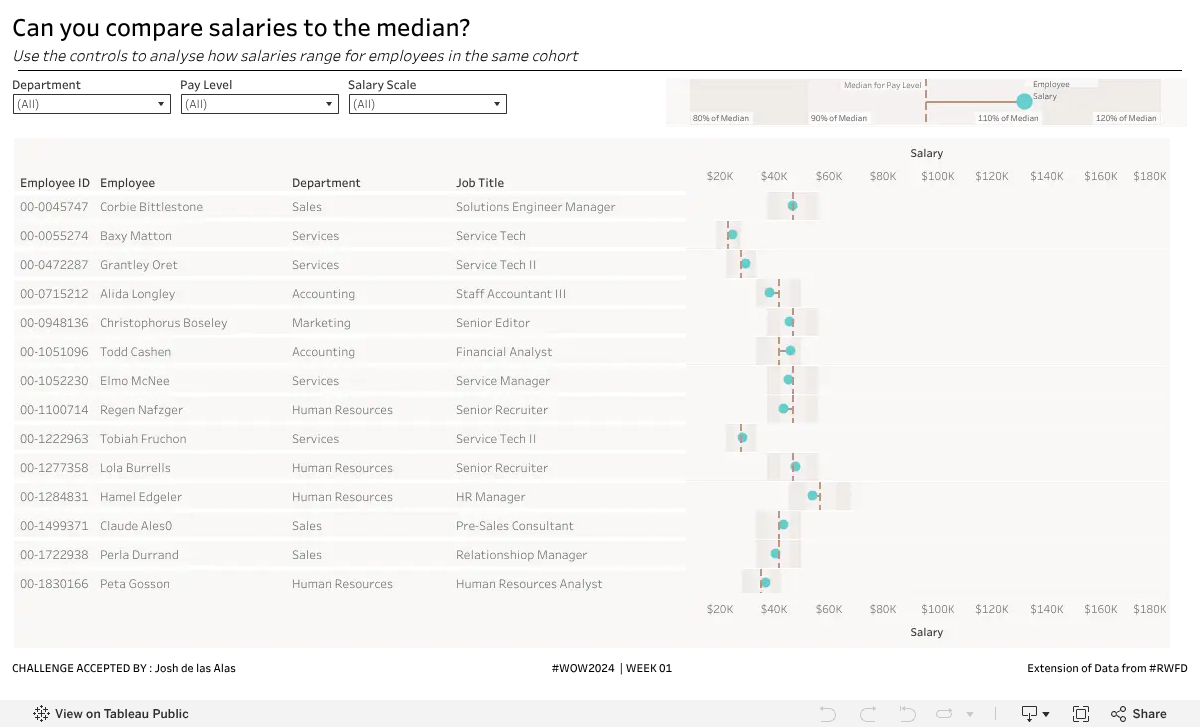
- KPI header, an education filter, a bin size parameter for age groups, and a satisfaction table
- What it shows
- 237 employees left, a 16.12% attrition rate.
Ad dataSummaryTeam inbox
- The problem
- The team rebuilt the same ad performance reports and daily summaries by hand.
- What I built
- Scheduled reports that pull the ad data, summarize it and send it to the team on their own.
- Result
- 6+ hours of manual reporting saved each week.
- Tools
- n8n, Meta Ads, AI summaries
Details are kept general and no company data is shown.
FormCleanQualifyCRM
- The problem
- Lead data came in incomplete and inconsistent, so qualifying leads was slow.
- What I built
- Automated lead management with one standard way to capture each lead at intake.
- Result
- Lead qualification 30% faster, with data accuracy above 90%.
- Tools
- Make, Airtable, Google Sheets
Details are kept general and no company data is shown.
BriefScriptGeneratePublish
- The problem
- Content production meant moving work by hand between separate AI tools.
- What I built
- One n8n pipeline connecting 6 AI tools through their APIs, with validation and triggers between steps.
- Result
- Its architecture became the spec for the company’s platform.
- Tools
- n8n, 6 generative AI APIs
Details are kept general and no company data is shown.
SourcesResearchDraftReview
- The problem
- Weekly LinkedIn research and first drafts took hours of manual work.
- What I built
- An AI agent workflow that gathers the week’s research and writes first drafts for a person to review.
- Result
- Weekly research and drafting automated, with a person approving every post.
- Tools
- Claude, AI agent workflow
Details are kept general and no company data is shown.
Power BI report
In progress
SQL projects
In progress
Python projects
In progress
About

I’ve spent seven years in business intelligence and automation, working wherever the numbers needed fixing.
I started out building executive dashboards in Tableau. Today I also automate the reporting behind them, so the numbers show up on time without anyone rebuilding them by hand.
Most of my work sits between the people asking the business question and the data that answers it.
On the job
The checkout numbers that didn’t match
- The problem
- The ad platform and the product analytics tool reported very different checkout counts, so nobody knew which number to trust.
- What I did
- Traced ad spend and the signup funnel across both systems to find where the counts split, then worked with engineering on the fix.
ResultOne checkout number the team could use
One view of what a customer costs
- The problem
- Acquisition cost, funnel conversion and AI generation cost lived in three separate tools.
- What I did
- Built a Tableau dashboard joining ad spend, product analytics and AI generation cost data.
ResultLeadership saw what each user costs in one place
Billing that reconciles
- The problem
- Billing, claims and reimbursement data didn’t line up.
- What I did
- Modeled the joins across all three sources and built reconciliation workflows on top.
ResultBilling accuracy up 20%